SMTP load testing with Apache JMeter in practice: 10,000 emails, five rule paths, one HTML report
An end-to-end load test in practice: a test plan with a message mix along the ruleset paths of an encryption gateway, a portable setup without installation, 10,000 emails in a burst, and analysis using the JMeter HTML report, including the issues that actually occurred.
The overview article on email load tests compared the tools and outlined the test plan. What follows is the practical implementation: a complete JMeter load test with 10,000 emails, a message mix along real gateway rule paths, and the HTML report for analysis. All values shown come from the actual run, including the errors encountered along the way.
The scenario is modelled on a real project: an Apache James-based email encryption gateway (Totemomail) sits as a smarthost loop behind Exchange Online and decides on encryption, signing and special routing for each message. The Mailet ruleset has several paths for this: subject triggers such as (sec), (sign) and (unsec), keywords such as VERTRAULICH for routing to an industry gateway, and the default path with certificate checking and plaintext fallback. A load test that submits only a single message type would always measure the same path through this ruleset; the test plan therefore models five classes whose mix corresponds to the expected traffic.
Important context: this test plan creates the load profile of many independent submitters, because JMeter opens a separate connection for every message (the background is covered in the limitations section at the end). For proving that a ruleset works correctly and quickly enough under parallel mixed traffic, this is the appropriate pattern. However, the plan does not model the peak load of a single bulk sender with open sessions; for this load profile, smtp-source from the overview article is the right tool.
The most important jmeter options
For orientation, here are the command-line options used in this article, translated broadly from the documentation:
The complete list is shown by jmeter -?; the options are described in the non-GUI operation chapter of the JMeter User’s Manual.
The setup: no installation required
The test ran on a Windows machine without Java or JMeter. Both can be used portably, which is crucial on admin workstations with restricted installation permissions: Temurin JRE as a ZIP from Adoptium, JMeter as a ZIP from apache.org, unpack both, set JAVA_HOME to the JRE directory, and you are done.
export JAVA_HOME="$PWD/jdk-21-jre"
export PATH="$JAVA_HOME/bin:$PATH"
./apache-jmeter-5.6.3/bin/jmeter -n -t gateway-lasttest.jmx -l lauf.jtl -e -o reportA local SMTP black box based on aiosmtpd served as the sink, just over 40 lines of Python: it accepts every message with 250, discards the content, counts it and assigns every email to a class based on its subject line. This independent count on the receiving side is the test’s control: if the generator and sink counts do not match, something was lost along the way.
from aiosmtpd.controller import Controller

class SinkHandler:
    def __init__(self):
        self.count = 0

    async def handle_DATA(self, server, session, envelope):
        self.count += 1
        # Hent emnet fra headeren for klassestatistikken,
        # Innholdet forkastes
        return "250 Message accepted for delivery"

controller = Controller(SinkHandler(), hostname="127.0.0.1", port=2525)
controller.start()
Important context: the generator and sink ran on the same machine, without TLS and without a network in between. The measured figures therefore do not say anything about a gateway; instead, they are the generator self-test from the overview article: proof that the load setup can produce the target rate at all, and the upper limit against which later measurements against the real test system are compared.
The test plan: five message classes, one mix
The core of the plan is a Thread Group with 20 threads, 10 seconds of ramp-up and 500 loops, giving 10,000 iterations. Under it are five Throughput Controllers in “Percent Executions” mode, each with exactly one SMTP Sampler:
| Class (sampler label) | Share | Rule path in the gateway |
|---|---|---|
| 01 Standard without trigger | 60% | AutoGenerated check, certificate check, plaintext fallback |
| 02 Trigger (sec) | 15% | TRE envelope for recipients without a certificate |
| 03 Trigger (sign) | 10% | Certificate Exchange: sign, send key along |
| 04 Keyword VERTRAULICH | 10% | Special routing to the industry gateway |
| 05 Trigger (unsec) | 5% | Plaintext enforced |
There is a practical reason for splitting the load across five separate samplers instead of using one sampler with a variable subject: the HTML report groups all metrics by sampler label. Five labels produce five rows in the statistics with their own percentiles per class; a single sampler with a CSV-fed subject would produce one aggregate row, and the difference between rule paths would be invisible in the analysis.
Each sampler fills in the usual fields: target host and port as user-defined variables (${zielhost}, ${zielport}), so the same plan can run unchanged against the sink, test environment or PreProd, plus sender, recipient, a subject with a clear marker (here, the word LOADTEST in the subject) and a text body of around 1 to 2 KB. The “Include timestamp in subject” option adds the submission time in milliseconds; in a later run against a real multi-stage system, this can be used together with the sink’s receipt times to calculate end-to-end latency per message.
One error from this run that can be generalised: the first attempt failed with 10,000 errors in 10 seconds, all with java.lang.ClassCastException ... NullProperty cannot be cast to ... CollectionProperty instead of an SMTP response. The cause was a manually created JMX file in which the sampler’s header list was missing; the sampler requires the property even when it is empty. The lesson is less about the specific property than the pattern: build and save test plans in the GUI, do not write XML manually, and before every burst, run a very small test and check at the sink that the subject and content actually arrive. An error rate of 100 percent at 0 ms response time almost always means that the error occurs before the network, so the test never reached the target system.
The run
The measurement itself runs in CLI mode; the GUI is only the editor. A single invocation generates the run, raw data and report:
jmeter -n -t gateway-lasttest.jmx -l lauf-10k.jtl -e -o report-10kThe summariser on the console shows progress live and the final result of the run:
summary = 10000 in 00:00:13 = 781.8/s Avg: 6 Min: 1 Max: 27 Err: 0 (0.00%)10,000 messages in 12.8 seconds, 782 messages per second on average, no errors. The sink independently confirmed exactly 10,000 accepted emails with the mix 6000 / 1500 / 1000 / 1000 / 500, meaning that the Throughput Controllers’ mix matched exactly down to the message.
The HTML report
The argument for JMeter over leaner generators such as smtp-source is the analysis, and the dashboard report delivers it without additional work:
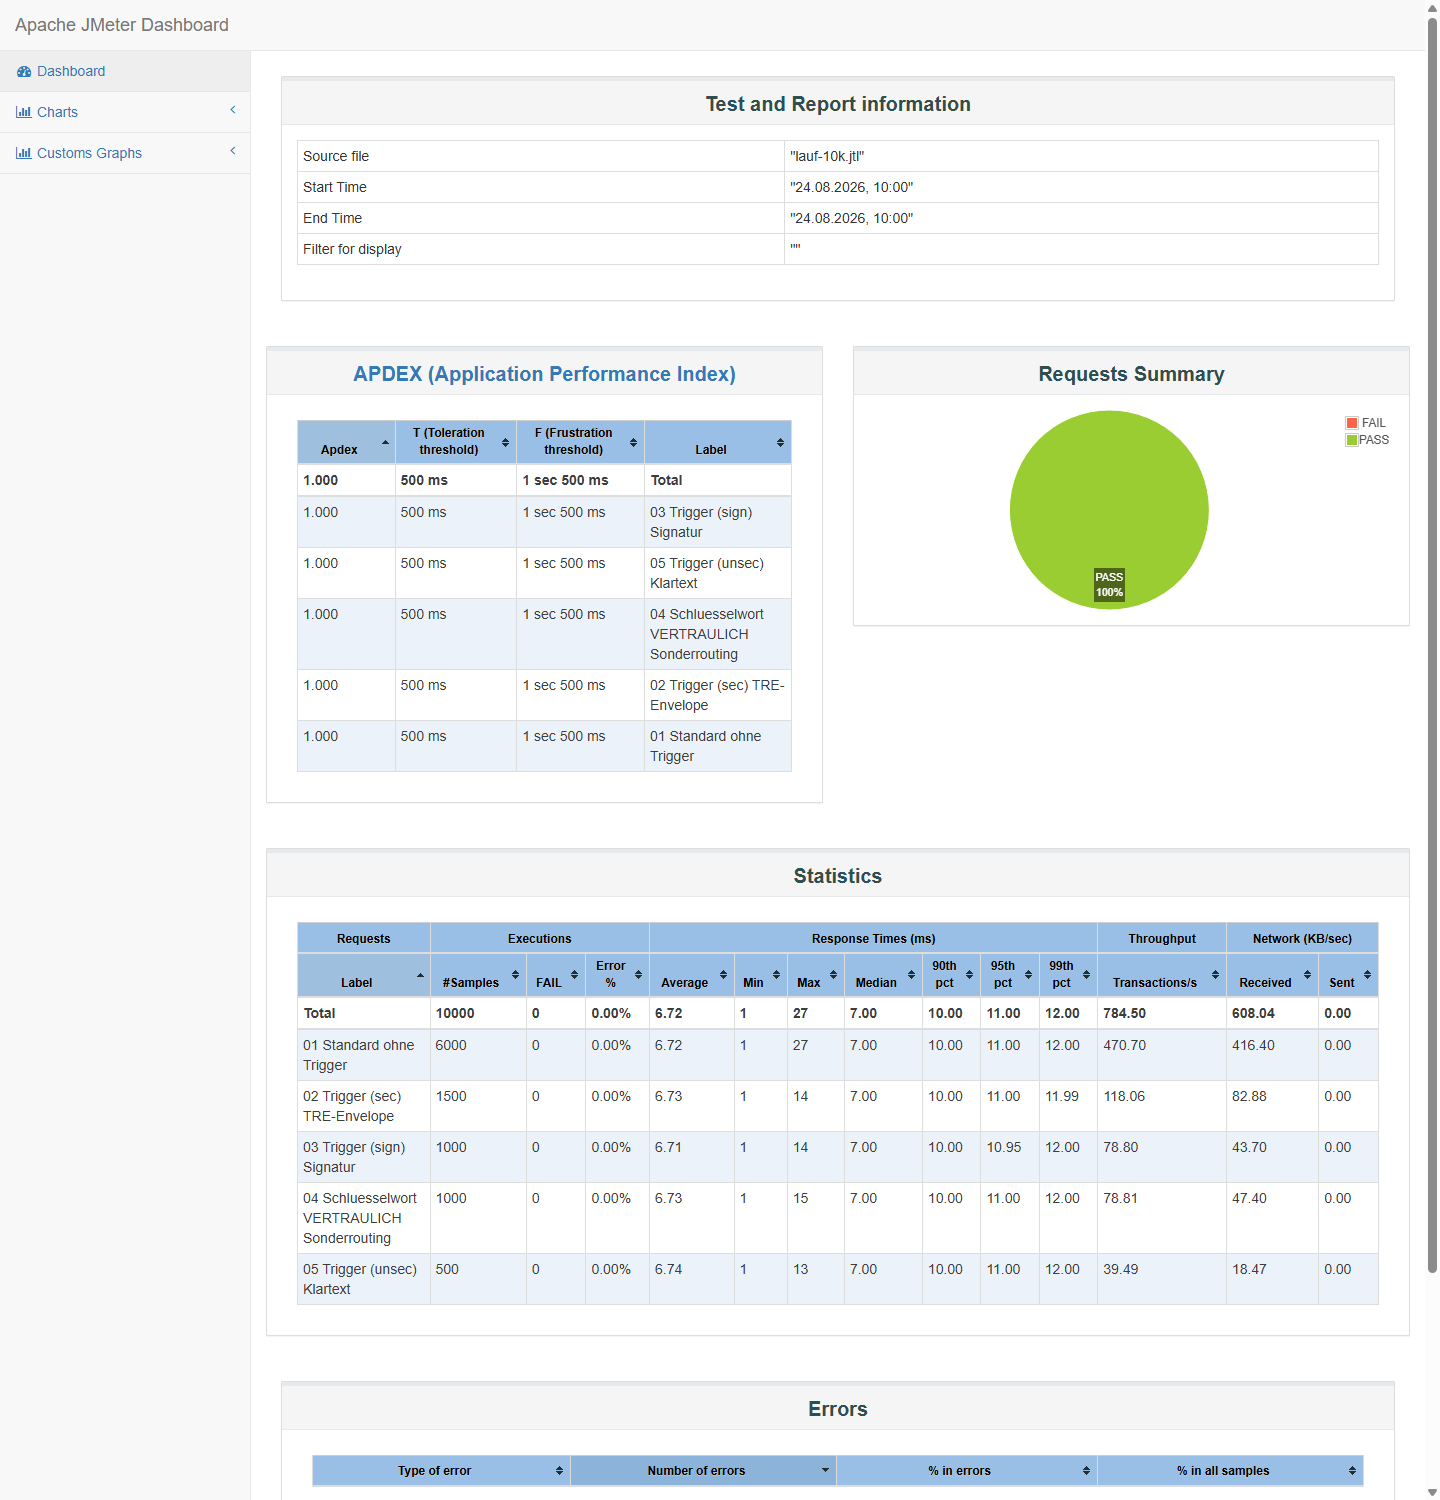
The statistics table is the most important part of the report. For each sampler label, and thus for each message class, it shows count, error rate, average, median, 90th, 95th and 99th percentiles, maximum and throughput. In the specific run: median 7 ms, p95 at 11 ms, p99 at 12 ms, maximum 27 ms, virtually identical across all five classes. With a local sink that treats every message identically, this is exactly the expected picture and also the reference value: if the same plan later runs against the real gateway and the (sec) class suddenly shows many times the standard median, that is the additional work of the encryption path, cleanly isolated per rule branch.
The APDEX block above condenses the same data into one figure per class (1.000 everywhere here, because all responses were well below the 500 ms tolerance threshold); the thresholds can be adjusted in the report properties to suit service targets. The Errors block remains empty in this run, but is the first place to look in tests against real systems: it groups errors by response text, so 421 throttling by the target system can immediately be distinguished from connection drops.
There is also a typical analysis error here, and it affects every short burst: by default, the report’s time-series charts use a granularity of one minute. A 13-second run therefore collapses into a single data point, and the curves under “Charts” look like a measurement error. The report can be regenerated from the existing JTL file without a new run at a finer resolution:
jmeter -g lauf-10k.jtl -o report-fein -Jjmeter.reportgenerator.overall_granularity=1000With second-level granularity, the single point becomes the actual load profile:
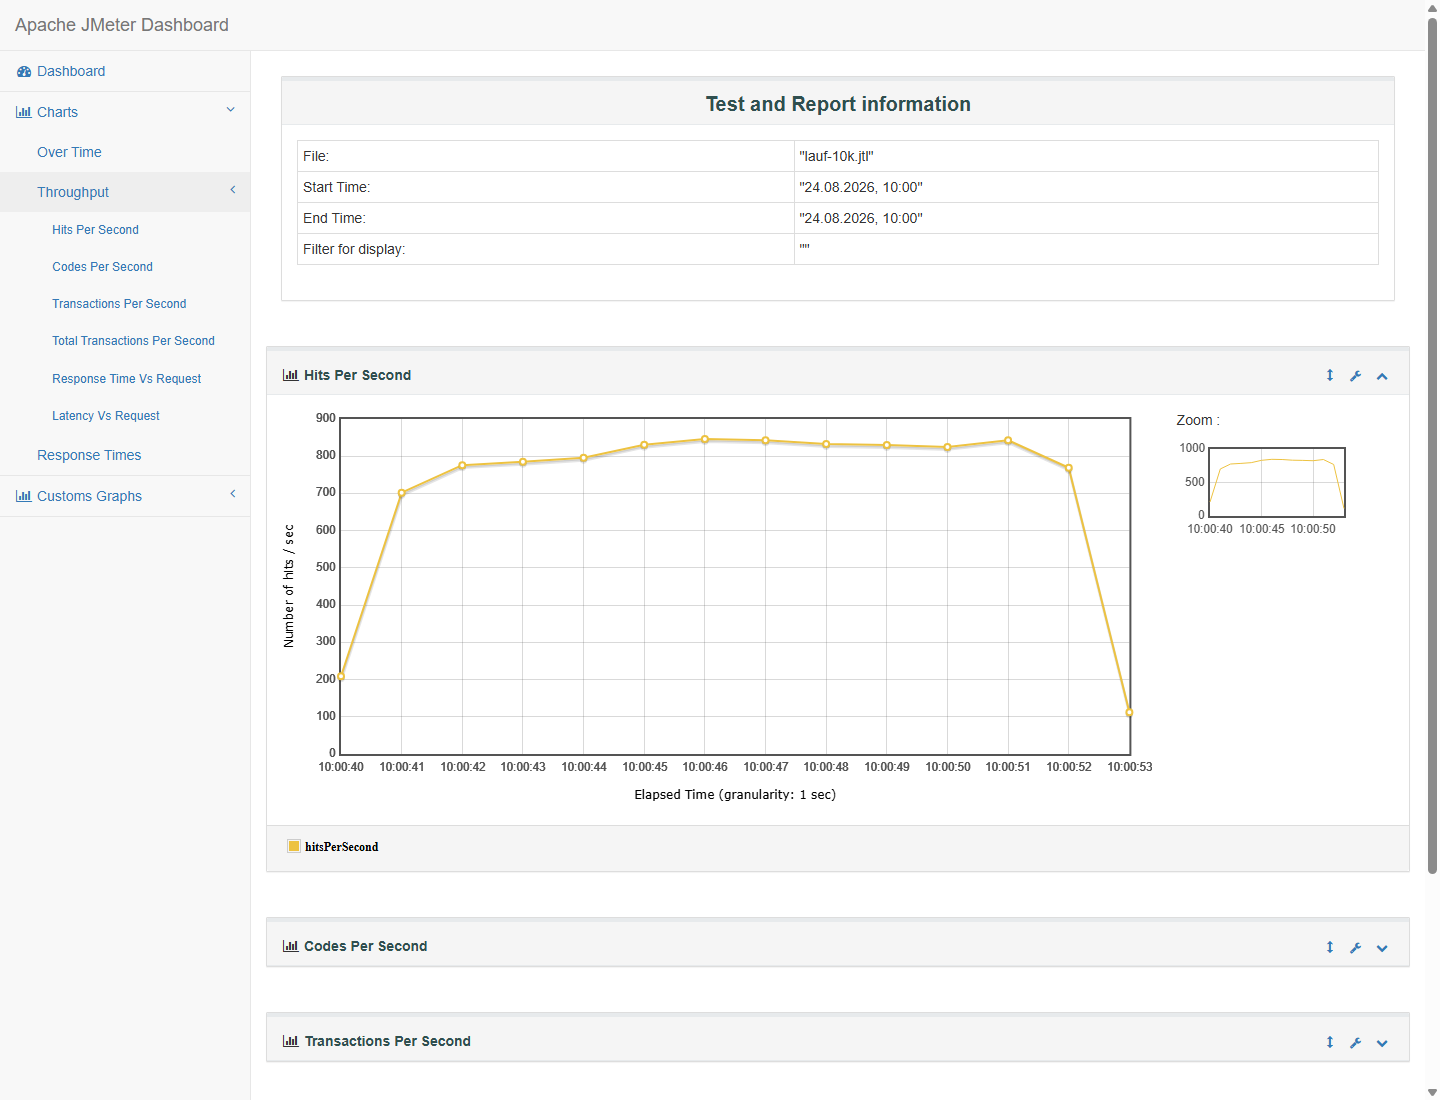
The curve shows the 10-second ramp-up, a plateau at around 840 messages per second and the drop at the end when the first threads complete their 500 loops. For interpretation, the plateau matters, not the average over the entire run: the average of 782/s includes ramp-up and ramp-down and underestimates the achieved sustained rate.
What this run proves and what it does not
What this run proves is: the test plan is functionally correct (small run with content verification at the sink), the mix matches exactly, and the generator achieves at least 840 messages per second on this machine without TLS. Anyone testing a gateway designed for 100 emails per second therefore has a reserve by a factor of eight and can confidently attribute bottlenecks to the target system.
Everything else is not proven, and this limitation belongs in every test report: there is no statement about TLS handshake costs (the real path uses STARTTLS), none about the gateway’s queue behaviour, and none about the processing time of the rule paths. For that, the same plan with changed variables zielhost/zielport points to the gateway test environment; the analysis then runs identically, supplemented by gateway logs and the queue observation from the overview article. This reusability—one plan for sink, test environment and PreProd with identical analysis—is the real reason to invest the effort in creating a proper JMeter plan once.
A limitation of the tool itself also belongs in this qualification: JMeter cannot keep SMTP sessions open. The SMTP Sampler opens a new connection for every message, goes through EHLO, optionally STARTTLS and AUTH, and closes it after exactly one transaction with QUIT. The 840 messages per second therefore include a complete connection setup for every message. A bulk sender sending hundreds of messages over an open session creates a different load profile at the gateway, with fewer connections and more transactions per connection, and connection limits therefore apply earlier under JMeter load. The reason lies in the framework architecture: JMeter measures each sampler as a self-contained, independent unit so that timers, assertions and percentiles work consistently across all supported protocols, and the SMTP Sampler is built on the JavaMail library, which connects and disconnects per send operation as a client API. SMTP has no connection reuse like the HTTP Sampler’s Keep-Alive. For the load profile of a bulk sender with an open session, smtp-source or a custom script are more suitable; the tool comparison in the overview article puts this into context.

Kommentarer
Kommentarene lastes inn fra GitHub / Giscus.